What is Best–Worst Scaling?
In a Best–Worst Scaling (BWS) task, participants see a small group of items at a time and choose which is best and which is worst on a dimension you define. For example, a linguist might ask which word sounds most intense and which sounds least intense.
By aggregating best–worst choices across many participants and item sets, you obtain a scale of all items — much more efficiently than pairwise ratings alone.
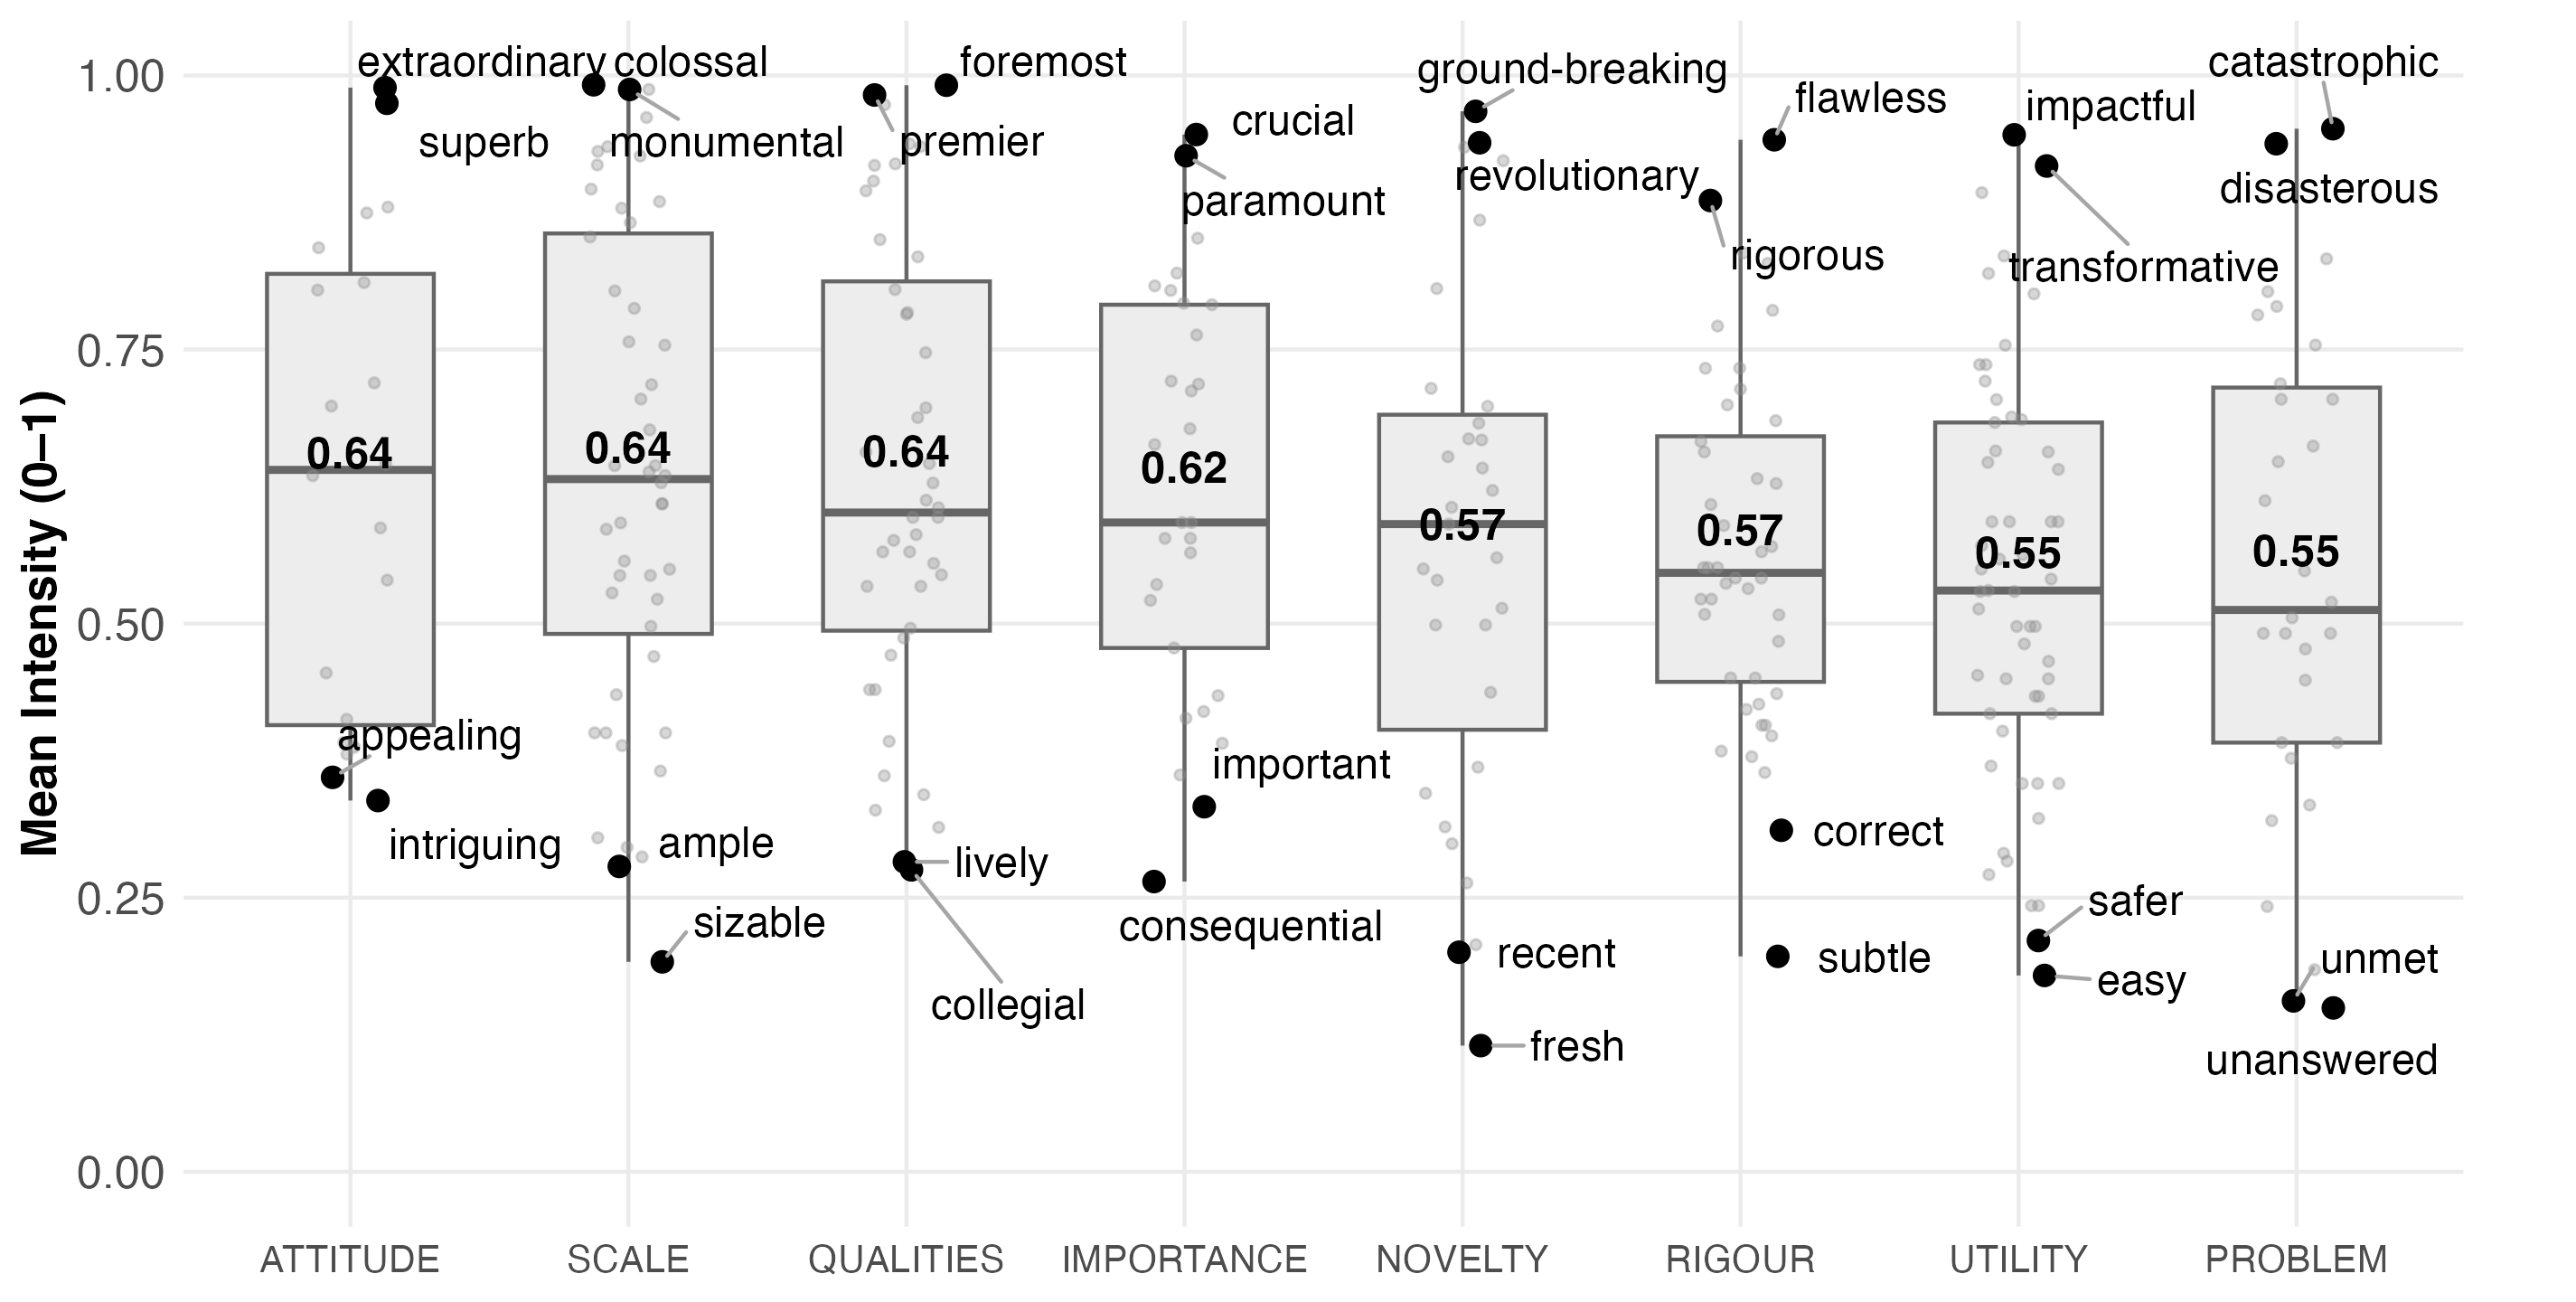
Distribution of Promotional Intensity Scores Across Hyplex Categories (mean intensity scores shown on boxplots).
How this tool works
This tool does not run surveys or collect responses. It generates the block design — the plan specifying which items appear together in each trial — that you then import into your own survey platform (Qualtrics, LimeSurvey, etc.).
- 1Enter your items. Paste or upload the list of items you want to scale. Include any anchor items you plan to use directly in this list.
- 2Choose block size k. Decide how many items appear in each trial (typically 3–5). Larger k gives more comparisons per trial but increases respondent effort.
- 3Choose a design approach. The tool shows whether a Balanced Incomplete Block Design (BIBD) is possible for your item count and k, or whether an approximate MaxDiff design is needed. You can also choose approximate if you want anchor boost.
- 4Configure anchors (approximate only). If you choose an approximate design, you can designate anchor items — items that appear more frequently across blocks to help link and calibrate the scale. Anchor items must already be in your item list.
- 5Set participant parameters. Choose how many blocks each participant sees and how blocks are assigned (randomised or rotated).
- 6Generate and export. The tool produces a block design and participant assignment table. Download both as CSV or JSON and import into your survey platform.
Design approaches
A mathematically exact design where every pair of items appears together the same number of times (λ times). All items appear with equal frequency. This gives the strongest statistical guarantees.
Only available for certain combinations of item count (v) and block size (k). When feasible, this tool uses the complete design (all C(v, k) combinations) or a cyclic construction with λ = 1.
- Perfect pair coverage
- Equal item frequency
- No anchor boost (all items equally frequent)
A greedy algorithm that builds blocks by always picking the least-seen items first, aiming for approximately equal coverage. Used when a BIBD is not possible (large item sets, unusual v/k combinations), or when you want anchor boost.
Connectivity is verified after generation (BFS on the co-occurrence graph); additional bridge blocks are added if needed.
- Works for any v and k
- Supports anchor boost
- Near-balanced but not exact
Anchor items
Anchor items are items that appear more frequently than others across blocks. They serve as reference points that help link participant-level scores onto a common scale, and can improve comparability across studies.
Anchor boost is only available with the approximate design, because BIBD enforces equal item frequency by construction. If you plan to use anchors, include them in your initial item list and choose the approximate design approach in the wizard.
A boost of 1.5× means anchor items appear roughly 50% more often than non-anchor items. Anchor–anchor co-occurrence is capped at ≈10% of blocks to avoid clustering.